Senior Executive · KKC & Associates LLP

Chaitali
Ranalkar.

Here's how I went from building ‘data dumps’ to designing actionable data products.

Pune, India  ·  MSc Big Data Analytics, St. Xavier's College

Manual effort removed
40%

of the manual work in ITGC testing & data extraction, automated away

100+
reconciliations
per cycle
50%
less document
review effort
40%
less manual
ITGC effort
0%
less manual effort in ITGC testing and extraction
0%
faster policy & audit document review
0+
GST reconciliations handled per cycle
0
documented SQL queries in one investigation

About

I like the
unglamorous data.

Most of my work happens inside audit — which means the datasets are messy, the stakes are compliance-shaped, and nobody is going to hand me a clean CSV. I build the tooling that makes that data usable: Python automation to pull structured tables out of hundreds of PDFs, Power BI dashboards with row-level security so each partner sees only their own numbers, NLP summarisation that runs entirely on-premises because audit documents can't leave the building.

Before KKC I did an MSc in Big Data Analytics at St. Xavier's, Mumbai, and a BSc in Mathematics before that. The maths still shows up more than I expected — mostly in knowing when a result is too clean to trust.

A flagged unknown is more useful to a business than a confident wrong answer.

Experience

Where I've worked

July 2025 — Present · Pune

Senior Executive

KKC & Associates LLP

  • Designed Power BI dashboards for audit KPIs and partner-wise reporting, with Row Level Security so each partner sees only their own engagements.
  • Automated ITGC testing and data-extraction workflows using Python and AI, cutting manual effort by 40%.
  • Built Python tooling to extract and consolidate data from multiple PDFs into structured Excel datasets ready for analysis.
  • Worked extensively in CaseWare IDEA to consolidate and summarise financial data for audit and review.
January 2025 — June 2025 · Mumbai

Data Analyst Intern

KKC & Associates LLP

  • Conducted audit data analysis across SQL, Power BI, Excel and CaseWare IDEA.
  • Developed end-to-end analytics covering financial performance, partner utilisation, billing and project tracking.
  • Created a Python NLP tool to summarise long policy and audit documents, speeding up compliance and control review.

Selected work

Things I've built

Two from inside the firm, and one long investigation I ran on my own to see how far I could push a diagnosis.

Professional Sept 2025

ITGC Automation Tool

An on-premises NLP summarisation tool for audit and policy documents. Audit material can't be sent to an external API, so the whole pipeline runs locally — upload, automated summarisation, and policy search across long control documents.

The same Streamlit application also automates GST R1 and 3B reconciliation: data extraction, validation and mismatch reporting, replacing a repetitive manual check that used to run every cycle.

PythonStreamlit NLPProcess automation GST reconciliation
0%
less manual review effort on policy documents
0+
reconciliations handled per cycle
0
documents sent outside the firm — fully on-premises

No screenshots. This tool runs on internal audit data, so I can describe the architecture and the outcome but not show the interface. The public rebuild below is how I demonstrate the same dashboard work without client data.
Professional Jan 2026

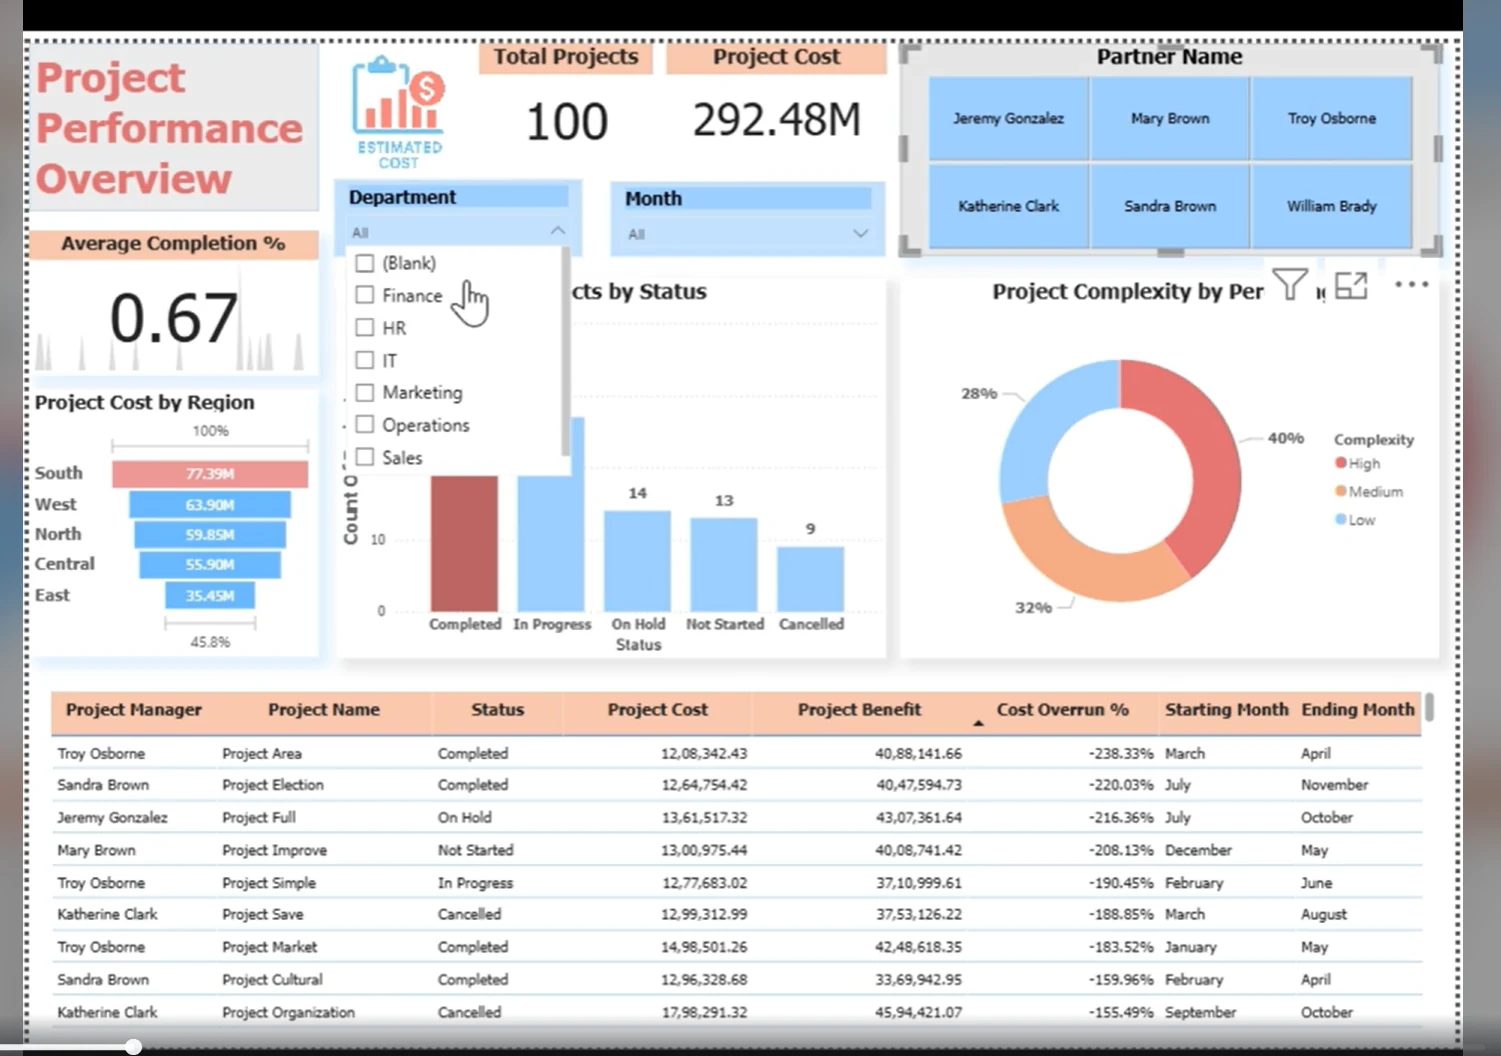
Project & Partner Management Dashboard

An end-to-end Power BI dashboard giving partner-level visibility into billing, resource utilisation and project progress — built so a partner can open one view and know where their engagements stand.

It supports year-over-year cost comparison across total hours and partner-level allocations, and multi-sheet reporting broken out by ITGC, ITAC and DA alongside overall financial and workload summaries.

Power BIDAX Data modellingRow Level Security
Power BI dashboard showing project status breakdown, complexity analysis, cost versus benefit and cost overrun percentage by project
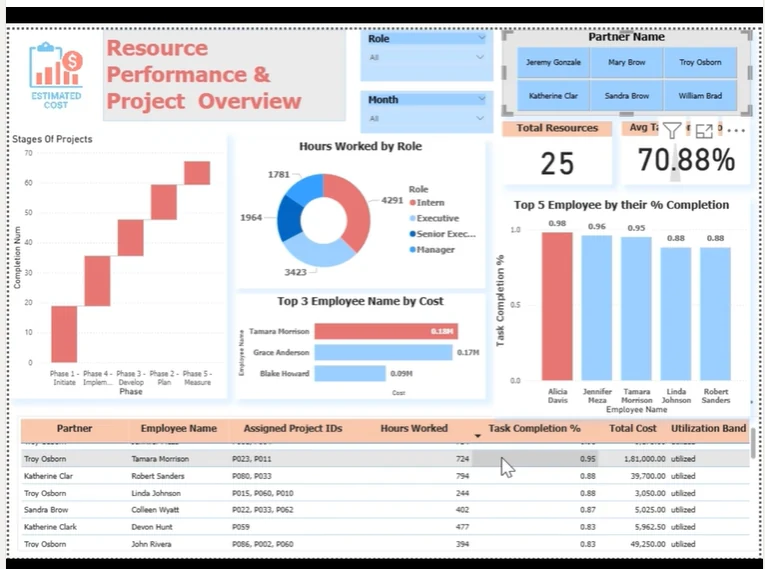
The public rebuild. Because the live dashboard holds client data, I recreated the same reporting independently on a public Kaggle dataset — project health, cost overruns, employee utilisation, with custom DAX for estimated cost and utilisation banding. Same build, no confidentiality problem.
Second dashboard page showing role-wise hours worked and employee utilisation tagging
Page 2 — Resource overview. Task completion by employee, role-wise hours, and over/under-utilisation tagging.
Independent project Full case study

Data on Demand — Quick-Commerce Gap Analysis

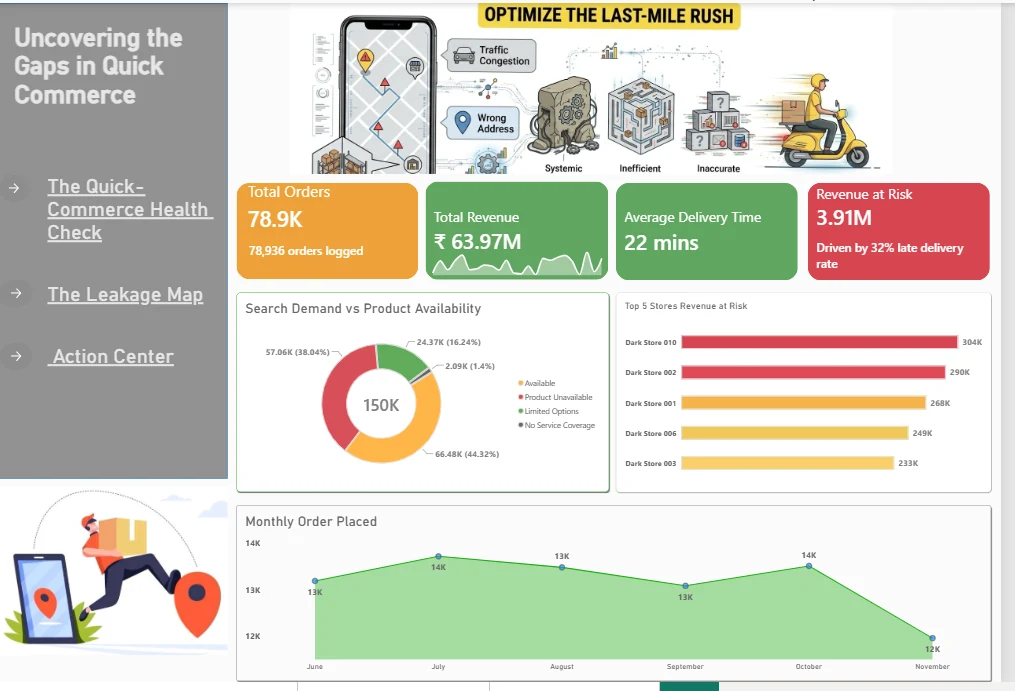
Real Zepto and Blinkit data isn't public, so I generated a realistic 150,000-search / 78,936-order dataset simulating a quick-commerce platform — customers, inventory, dark stores, deliveries, fees, support tickets — then investigated it as though it were live. Python → BigQuery SQL → root-cause analysis → Power BI.

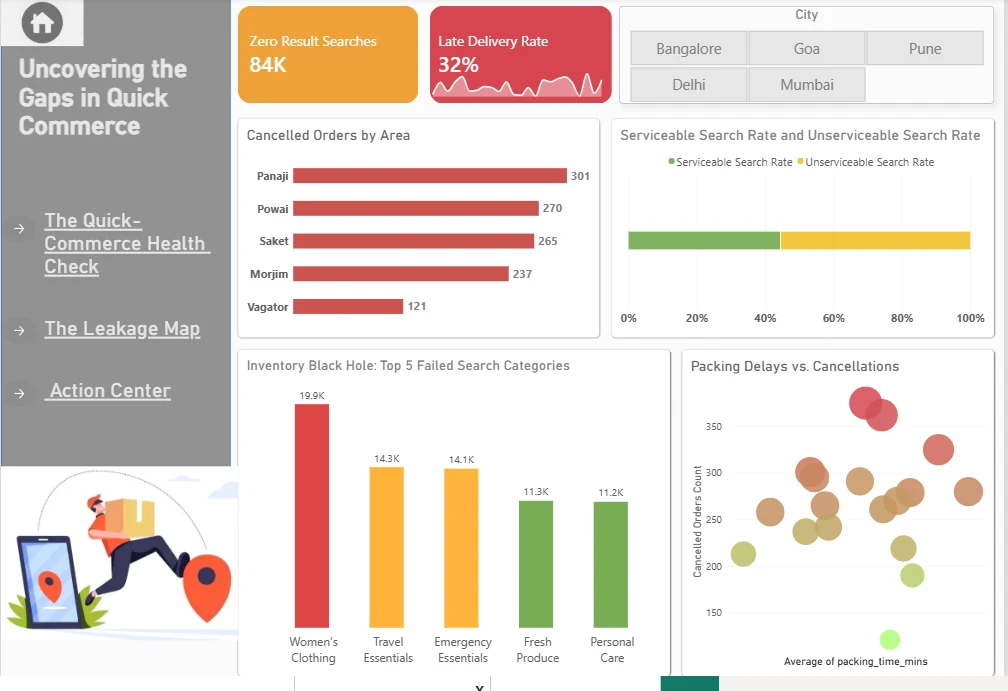
The headline finding: 54.28% of customer searches ended in Product Unavailable or Limited Options, concentrated in identifiable SKUs — Cola at 78.4%, Sanitary Pads at 75.9%, Power Bank at 71.3%.

PythonBigQuery SQL Power BI26 documented queries

The finding I couldn't close

One dark store behaved unlike every other store in the network.

?

Dark stores are the small neighbourhood warehouses quick-commerce apps deliver from — stocked like a shop, but closed to walk-in customers and serving only a delivery radius. Every order in the dataset is picked, packed and dispatched from one of them. DS009 is simply the ID of one such store, and it was the outlier.

MetricDS009Network average
Avg. delivery time31.69 min22.12 min
Avg. delay12.03 min4.13 min
On-time rate6.13%~41–43%
H1
Peak-hour load
Ruled out
H2
Distance to customer
Ruled out
H3
Order workload
Ruled out
H4
Picking & packing time
Ruled out

All four ruled out. So I wrote it up as unresolved.

I ran the investigation as a chained sequence of SQL queries, each one closing off a candidate cause. When every explanation failed, I documented DS009 as an unresolved operational anomaly and flagged it for manual, on-the-ground investigation — rather than picking the most plausible-sounding cause and presenting it as an answer.

Power BI dashboard page showing order volume, revenue, delivery speed and product availability
Page 1 — The Health Check. Order volume, revenue, delivery speed and which dark stores carry the most revenue at risk.
Power BI dashboard page mapping zero-result searches, late deliveries and cancelled orders by area
Page 2 — The Leakage Map. Where demand is lost: zero-result searches, late deliveries and cancelled orders by area.
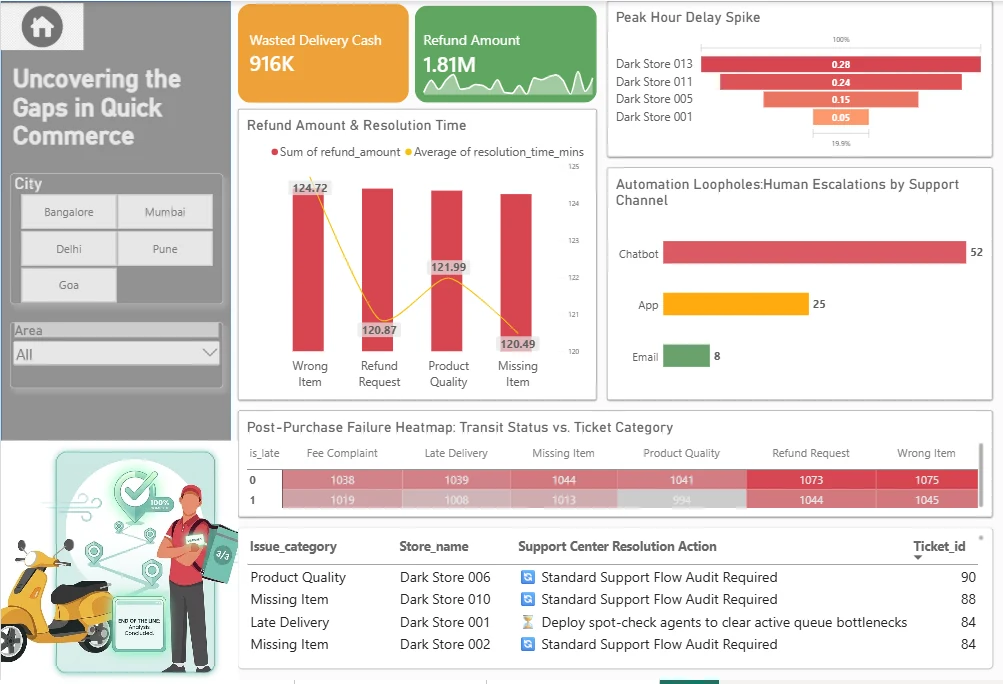
Power BI dashboard page showing refund amounts, resolution times and peak-hour delay spikes
Page 3 — The Action Center. Refund amounts, resolution times, peak-hour delay spikes by store, and resolution actions by ticket.

Read all 26 queries on GitHub →

Smaller studies

Forecasting, classification and dashboard work from coursework and independent practice.

ETH-USD Time Series Forecasting

Benchmarked four forecasting approaches on five years of daily Ethereum prices, scored by RMSE on a held-out test set. LSTM won by roughly 7.6× — the price series carries non-linear structure the classical models simply can't see.

LSTM 135.82
SARIMA 1031.44
Holt's Winter 1040.08
Prophet 1594.13
Pythonstatsmodels TensorFlowProphet
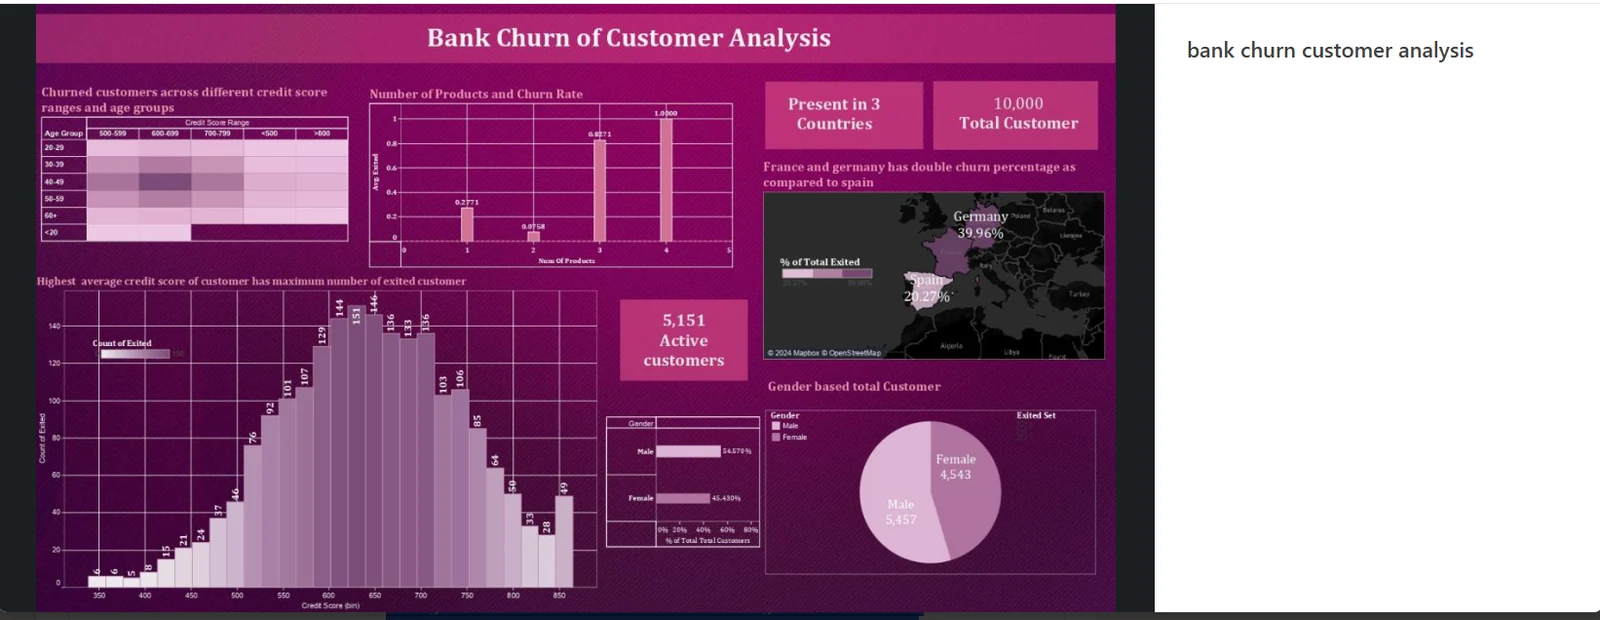
Tableau dashboard analysing bank customer churn by country, product count and credit score

Bank Customer Churn Prediction

Churn across 10,000 customers in 3 countries, modelled with Decision Tree, Random Forest, XGBoost and Gradient Boost, then tuned and scored on accuracy, precision, recall and F1. Customers holding 4 products churned at close to 100% — over-selling tracks with dissatisfaction, not loyalty.

Pythonscikit-learn XGBoostTableau
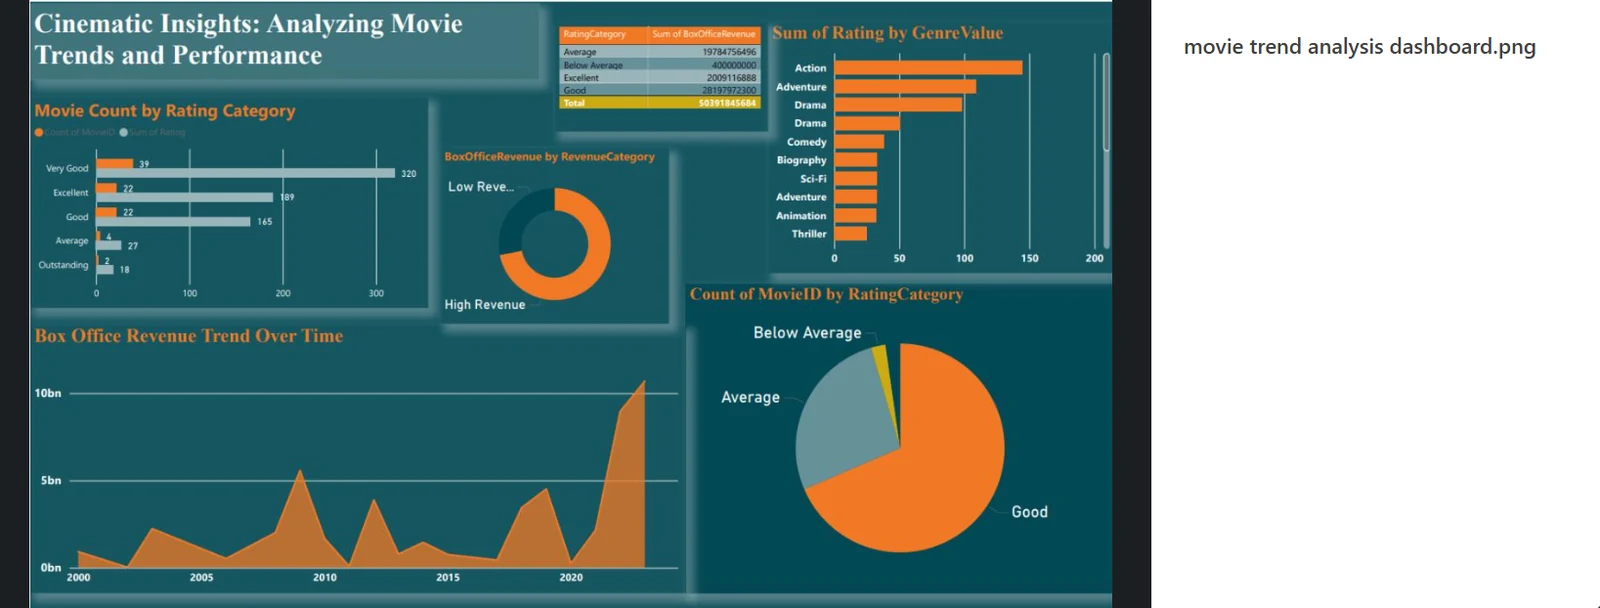
Power BI dashboard showing box office revenue trends, genre performance and audience ratings

Cinematic Insights: Movie Trends

A Power BI dashboard on box office revenue, genre performance and audience ratings across two decades, segmenting titles into high and low revenue bands to isolate what separates hits from underperformers.

Power BIData modelling

More on GitHub

Every independent project above is public, with the notebooks, SQL and documentation that produced it — including all 26 BigQuery queries from the quick-commerce investigation, each annotated with its business purpose and result.

How I work

Four things I've come
to believe about data.

Tools change every couple of years. These don't. Each one came out of the work above — usually the hard way.

01

An honest unknown beats a confident guess.

The pressure in analysis is always to produce an answer. But a wrong cause sends people to fix the wrong thing, and they lose weeks before anyone notices. If the data won't support a conclusion, the finding is that it won't.

In practice I spent four query chains trying to explain DS009's delivery times. Every hypothesis failed. I shipped it as unresolved, flagged for on-site investigation — which is the only honest version.
02

Build where the data already lives.

The most capable tool is worthless if using it means moving sensitive data somewhere it isn't allowed to go. Constraints on where data can travel aren't obstacles to design around — they're the first thing the design has to answer to.

In practice Audit documents can't leave the firm, so the NLP summarisation tool runs entirely on-premises. No external API, no documents in transit, same result.
03

If I can't show the work, I rebuild it.

Most of what I build belongs to clients, and none of it can go in a portfolio. That's not a reason to have nothing to show — it's a reason to reconstruct the same problem on data that's free to travel.

In practice The partner dashboard is confidential, so I rebuilt the same reporting on a public dataset — same DAX, same utilisation logic, nothing to redact.
04

The repetitive part is the interesting part.

Every manual process that runs monthly is a standing invitation. The work isn't just faster afterwards — it's more consistent, and it frees the hours that actually need judgement for the questions that actually need judgement.

In practice Reconciliation checks that once ate a cycle now run as a validated pipeline — 100+ per cycle, 40% less manual effort in ITGC testing.

Toolkit

What I work with

Programming & DS

  • Python
  • R
  • Machine Learning
  • Deep Learning
  • Statistical Analysis
  • Generative AI
  • Prompt Engineering

Analytics & BI

  • SQL
  • Power BI
  • DAX
  • Excel
  • Data Modelling
  • Data Transformation
  • Database Design
  • Query Optimisation

Automation & Audit

  • CaseWare IDEA
  • ITGC
  • ITAC
  • Power Automate
  • Process Automation

Specialisations

  • Microsoft Power BI
  • Python Automation
  • AI-Assisted SQL
  • Business Intelligence
  • Problem Solving
  • Analytical Thinking

Education

M.Sc. Big Data Analytics

St. Xavier's College, Mumbai

Aug 2023 — Jun 2025
9.51 / 10CGPA

B.Sc. Mathematics

B. N. Bandodkar College

Jun 2020 — Jun 2023
9.25 / 10CGPA

Certificates

Generative AI SQL Database Specialist with ChatGPT Latest

Vanderbilt University · Coursera · Jul 2026

AI-assisted SQL generation, database design, prompt engineering, AI-powered SQL analysis and query optimisation.

Introduction to Cloud Computing

SimpliLearn · Jan 2024

Machine Learning

Great Learning Academy · Dec 2023

Contact

Let's talk.

Happy to hear about analyst roles, tricky datasets, or anything in the work above. Email is the quickest way to reach me.