Research & Projects

Chaitali Ranalkar

Here's how I went from building ‘data dumps’ to designing actionable data products.

0K
customer records analysed in a single investigation
0
machine-learning models benchmarked head to head
0%
of manual audit testing automated away

01 Projects

Built and shipped

Professional and independent work — where the data is real, messy, and usually confidential.

Independent Python · BigQuery · Power BI2026

Quick-Commerce Gap Analysis

The idea

A ten-minute delivery app knows exactly which orders failed. It has almost no idea which customers it lost before an order ever existed.

When a quick-commerce app misses its promise, the company sees a cancelled order and blames the rider. I wanted to test that instinct — because the moment a customer gives up usually happens long before a delivery is late.

Zepto and Blinkit don't publish operational data, so I built one that behaves like theirs: 150,000 searches and 78,936 orders across dark stores, inventory, delivery times, refunds and support tickets — complete with the inconsistencies a real platform carries. Then I worked it as though I'd been handed it on my first day, with no one to tell me where to look.

The instinct was wrong. Most demand never reached the delivery stage at all — 54.28% of searches ended with the product simply not there. A team optimising riders would have been fixing the wrong half of the business.
0%
of searches ended with no product available
0
BigQuery queries, each documented with purpose and result
0
hypotheses tested on one anomaly — all four eliminated
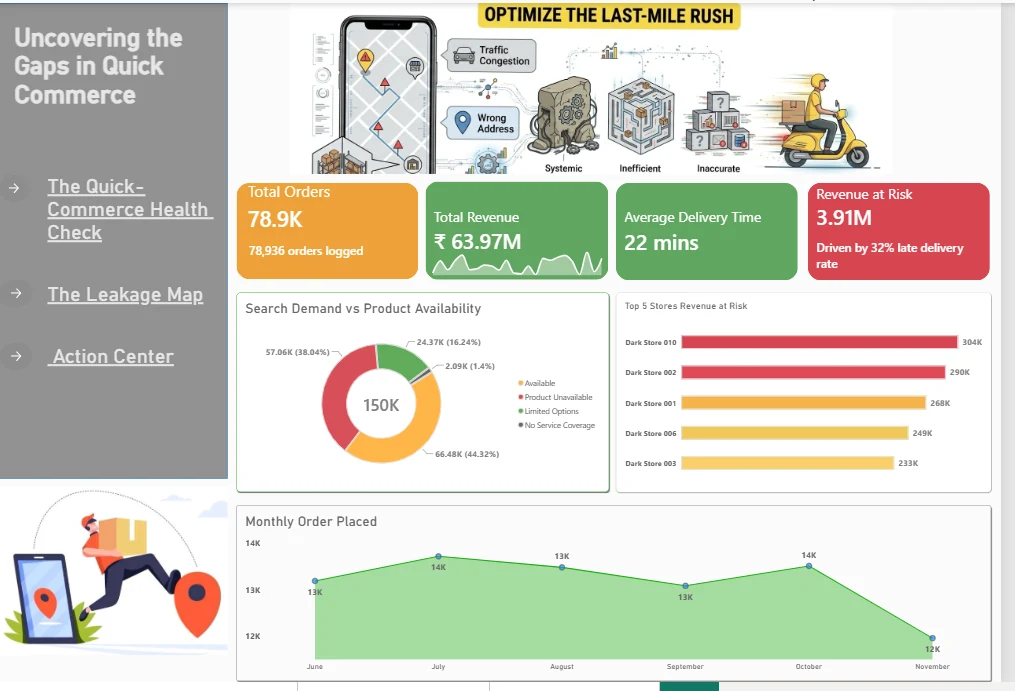
Power BI page showing order volume, revenue, delivery speed and product availability
Page 1 — Health check. Order volume, revenue, delivery speed and which dark stores carry the most revenue at risk.
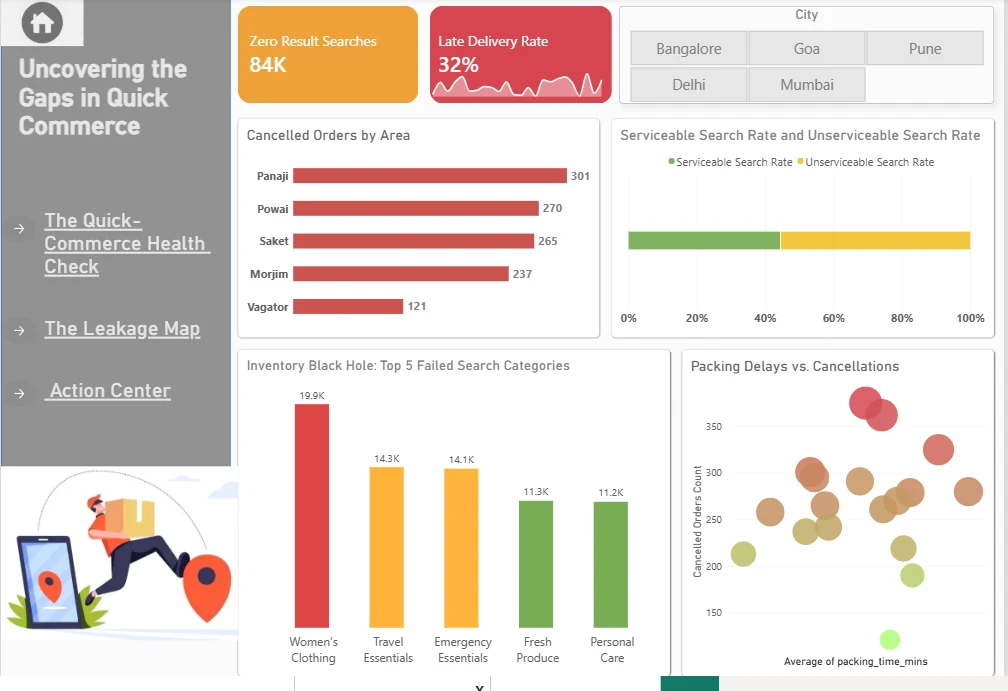
Power BI page mapping zero-result searches, late deliveries and cancelled orders by area
Page 2 — Leakage map. Where demand is lost: zero-result searches, late deliveries, cancellations by area, and the categories worst hit.
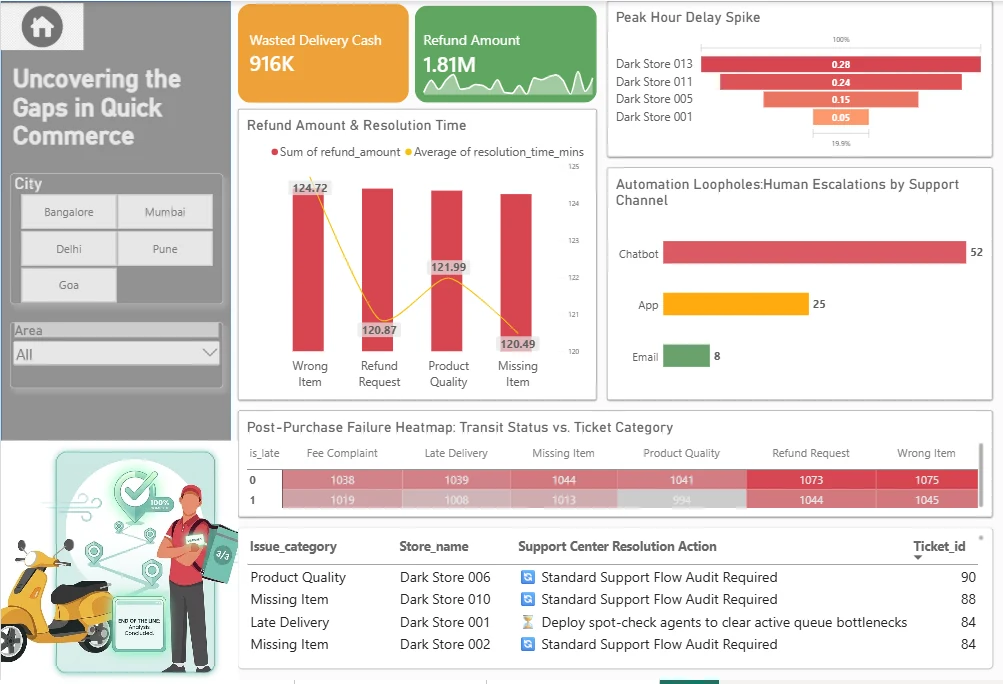
Power BI page showing refund amounts, resolution times and peak-hour delay spikes
Page 3 — Action center. Refund amounts, resolution times, peak-hour delay spikes by store, and the resolution action per ticket.

The part I couldn't finish

One store delivered on time 6.13% of the time. The network average was around 42%.

H1
Peak-hour load
Ruled out
H2
Distance to customer
Ruled out
H3
Order workload
Ruled out
H4
Picking & packing
Ruled out

Four explanations, four dead ends.

I published it as an unresolved anomaly flagged for on-site investigation. Picking the most plausible-sounding cause would have been faster, and wrong — and someone would have spent a quarter fixing the wrong thing.
PythonBigQuery SQL Power BIRoot-cause analysis
Read all 26 queries on GitHub →
Professional Power BI · DAX2026

Project & Partner Management Dashboard

The problem

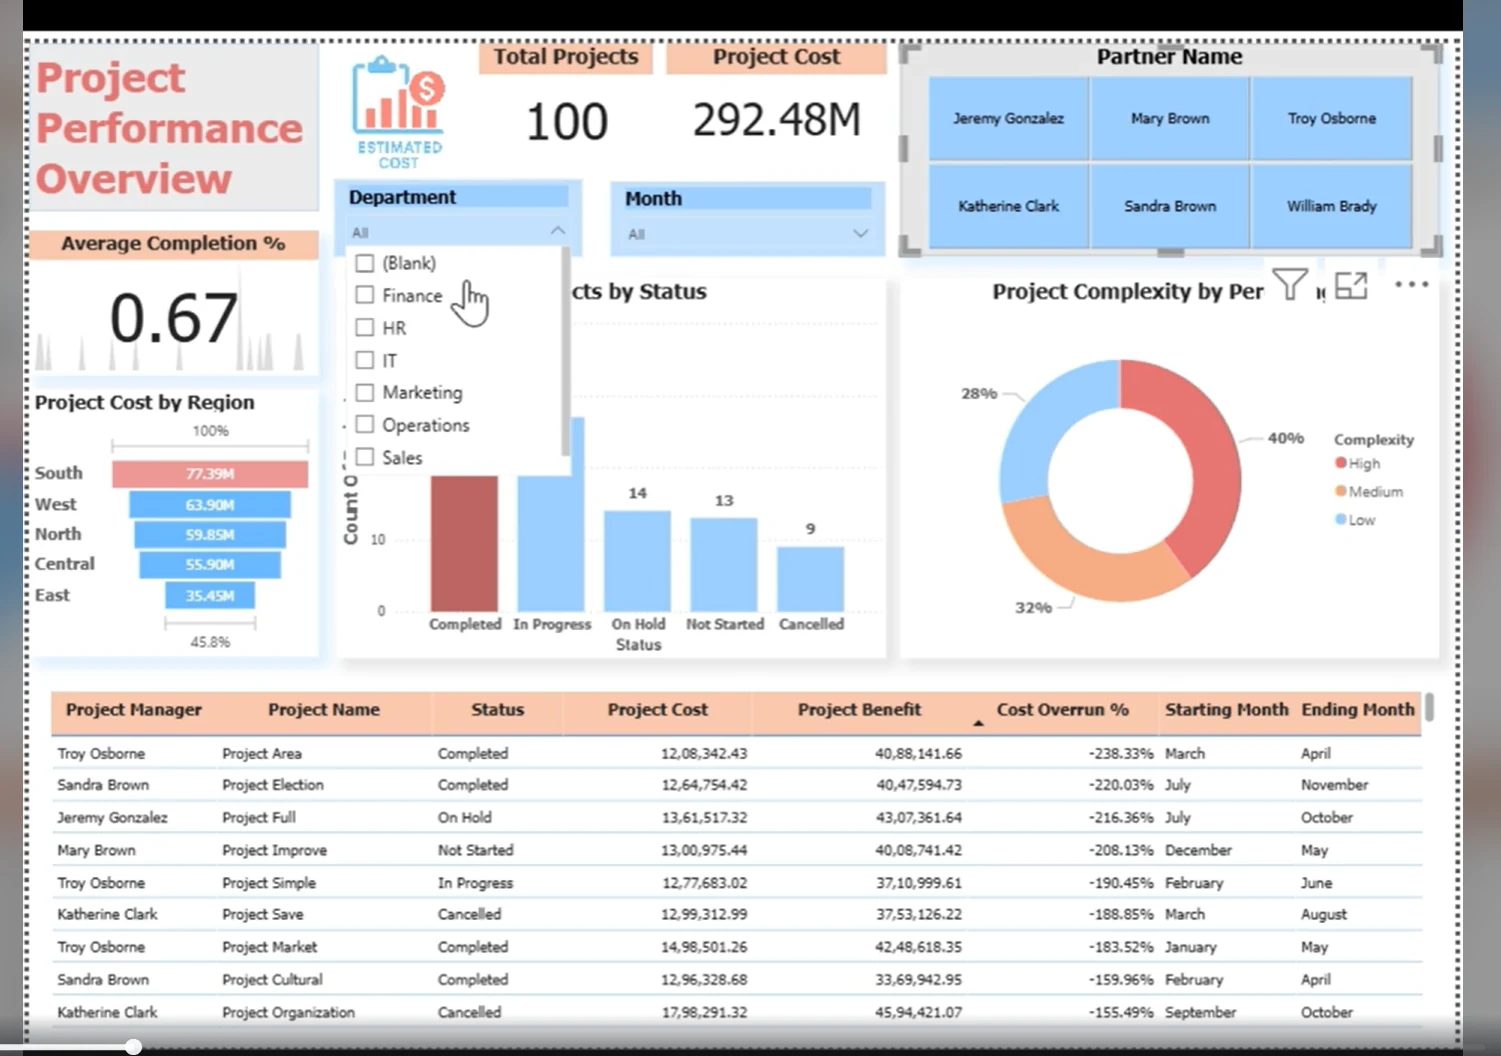
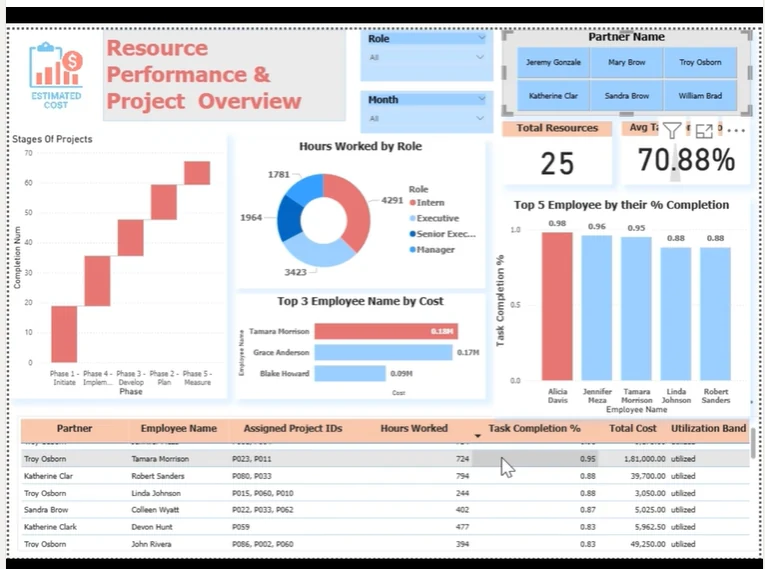
Partners needed one view of billing, utilisation and project health — without seeing each other's engagements.

Dashboard sheet one: project status, complexity, cost versus benefit and cost overrun by project
Sheet 1 — Project overview Status, complexity, cost vs. benefit and cost-overrun % by project and region.
Dashboard sheet two: role-wise hours worked and employee utilisation tagging
Sheet 2 — Resource & utilisation Task completion by employee, role-wise hours, and over/under-utilisation bands driven by custom DAX.

Access is enforced by row-level security in the data model rather than by convention, so a partner physically cannot query another's engagements. Year-over-year cost comparison runs across total hours and partner allocations, with breakdowns by ITGC, ITAC and DA.

The production dashboard holds client data. Shown here is an independent rebuild on a public dataset — same DAX, same utilisation logic, nothing to redact.

Power BIDAX Row-level securityData modelling
Professional Python · Streamlit · NLP2025

ITGC Automation Tool

The constraint

Audit documents cannot be sent to an external API. The model had to come to the data, not the other way round.

0%
less manual review effort on policy documents
0+
GST reconciliations processed per cycle
0
documents leaving the firm — fully on-premises

An entirely local NLP pipeline — upload, summarise, search — over long audit and policy documents, plus a Streamlit application automating GST R1 and 3B reconciliation with validation and mismatch reporting.

No screenshots: it runs on internal audit data. Architecture and outcome I can describe; the interface I can't show.

PythonStreamlit On-premises NLPProcess automation

02 Research

M.Sc. studies, in full

Question first, method as actually run, results as they came out — then what the work does not establish. That last part is the one I care about.

Research Project Unsupervised learning2024–25

Customer Segmentation using the RFM Model and K-Means

Question

Can raw transactions become a segmentation that is both statistically defensible and specific enough to act on?

Method

Transactions→Aggregate per customer→ RFM→Log transform→ Min–Max→K-means→Elbow

Aggregated per CustomerID into Recency, Frequency and Monetary. Log transform for the heavy right skew of transactional spend; Min–Max so Monetary couldn't dominate the distance metric through its units alone. UK customers only — less regional noise, narrower claim.

I ran two segmentations on purpose: a rule-based RFM quintile score (555 top, 111 lost) and K-means on the same features. One interpretable by construction, one learned. Reading them against each other is what exposed the limitations.

Results

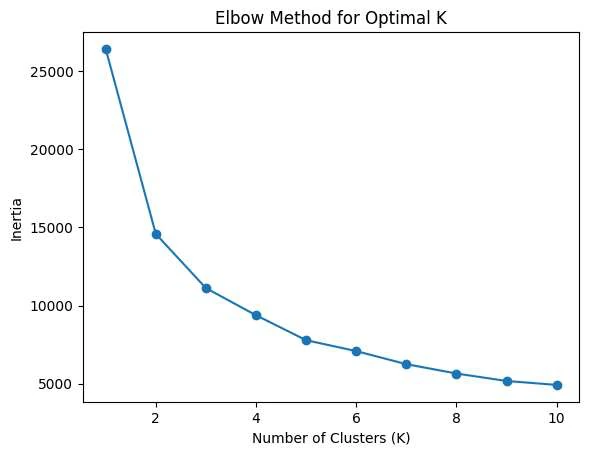
Elbow plot of within-cluster sum of squares against number of clusters, bending at K equals 3
Elbow selection. Inertia against K, bending at K = 3.
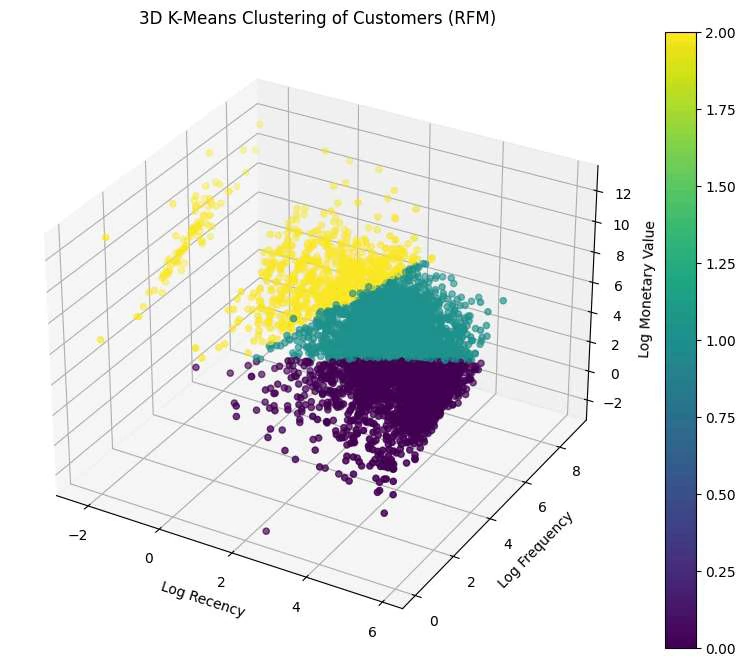
3D scatter of customers in log-Recency, log-Frequency and log-Monetary space coloured by three K-means clusters
The segments in log-RFM space — at-risk, potential loyalists, loyal.

Three readable segments. The rule-based codes agreed at the extremes and disagreed in the middle — exactly where a hard partition is least defensible.

What this does not establish

  • The elbow is a heuristic, not a criterion. No silhouette or gap statistic was computed, so validity is argued visually rather than measured.
  • K-means assumes a shape the data doesn't have. It wants spherical, equal-variance clusters under Euclidean distance; log-RFM space is neither, so the boundary is partly an artefact of forcing a partition onto a continuum.
  • Outliers pull centroids. A few very high-Monetary customers exert influence far beyond their count, and K-means can't set them aside.
  • Agreement isn't validation. Both segmentations use the same three features, so they share their blind spots.
Coursework Project Supervised learning2024

Predicting Customer Churn: five classifiers compared

Question

Which model family earns its complexity on tabular behavioural data — and what drives the prediction once you look inside?

Method

One-hot for Geography, binary for Gender, identifiers dropped, skewed features normalised. Five classifiers on a held-out split; the random forest tuned by randomised search over a 5-fold cross-validated grid.

Results

ModelAccuracyPrecisionRecallF1ROC-AUC
Logistic regression75.67%————
Gradient boosting84.13%0.8340.7150.770—
XGBoost86.61%0.8360.7930.8140.9322
Random forest87.98%0.8570.8090.8320.9396
Random forest, tuned88.06%0.8590.8090.833—

Scroll the table sideways →

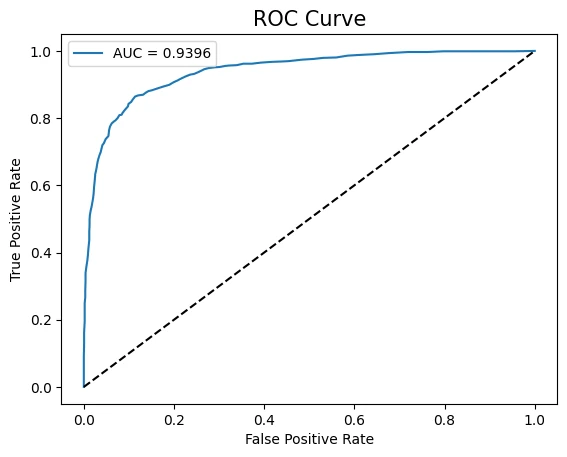
ROC curve for the random forest classifier with area under the curve 0.9396
Random forest ROC, AUC 0.9396 — the best separation of the five.
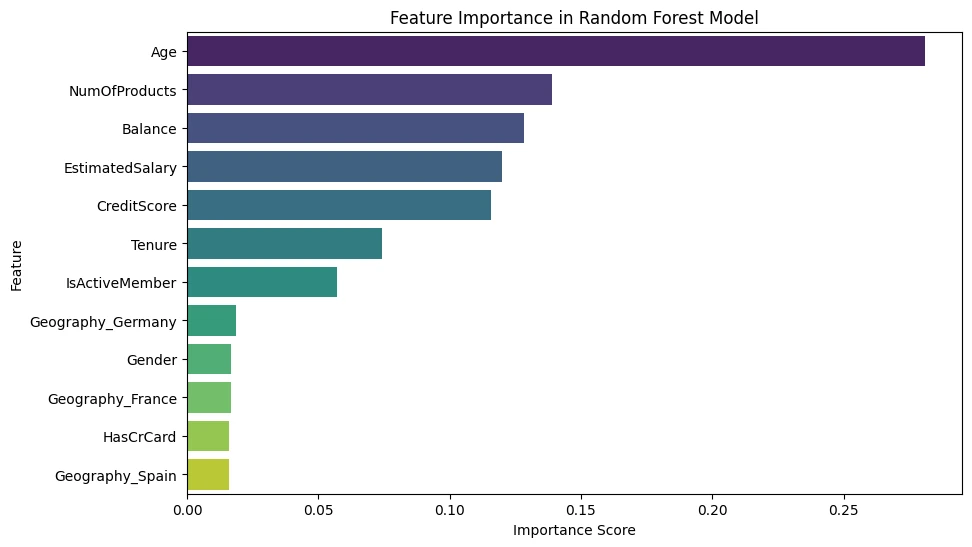
Bar chart of random forest feature importances with Age highest at 0.28
Feature importance. Age at ≈0.28, roughly double the next feature.

Age outweighs every financial attribute — which reframes churn here as life-stage rather than economics. And logistic regression trails by twelve points, so the boundary is genuinely non-linear, not just noisy.

What this does not establish

  • Tuning bought nothing. 87.98% → 88.06% is eight hundredths of a point, inside run-to-run variance. That's a null result, not an improvement.
  • Imbalance flatters every model. Churners are ~20% of the sample, so predicting "stays" scores near 80%. Recall tops out at 0.81 — one churner in five still missed.
  • Impurity importance is biased toward continuous features. Age is continuous, Gender binary; the gap is partly an artefact of the measure.
  • No calibration. AUC says the scores rank well; nothing here says the probabilities mean what they claim — and any cost-sensitive threshold depends on exactly that.

03 Coursework & explorations

Smaller studies

Dashboards and model comparisons from the M.Sc. and independent practice.

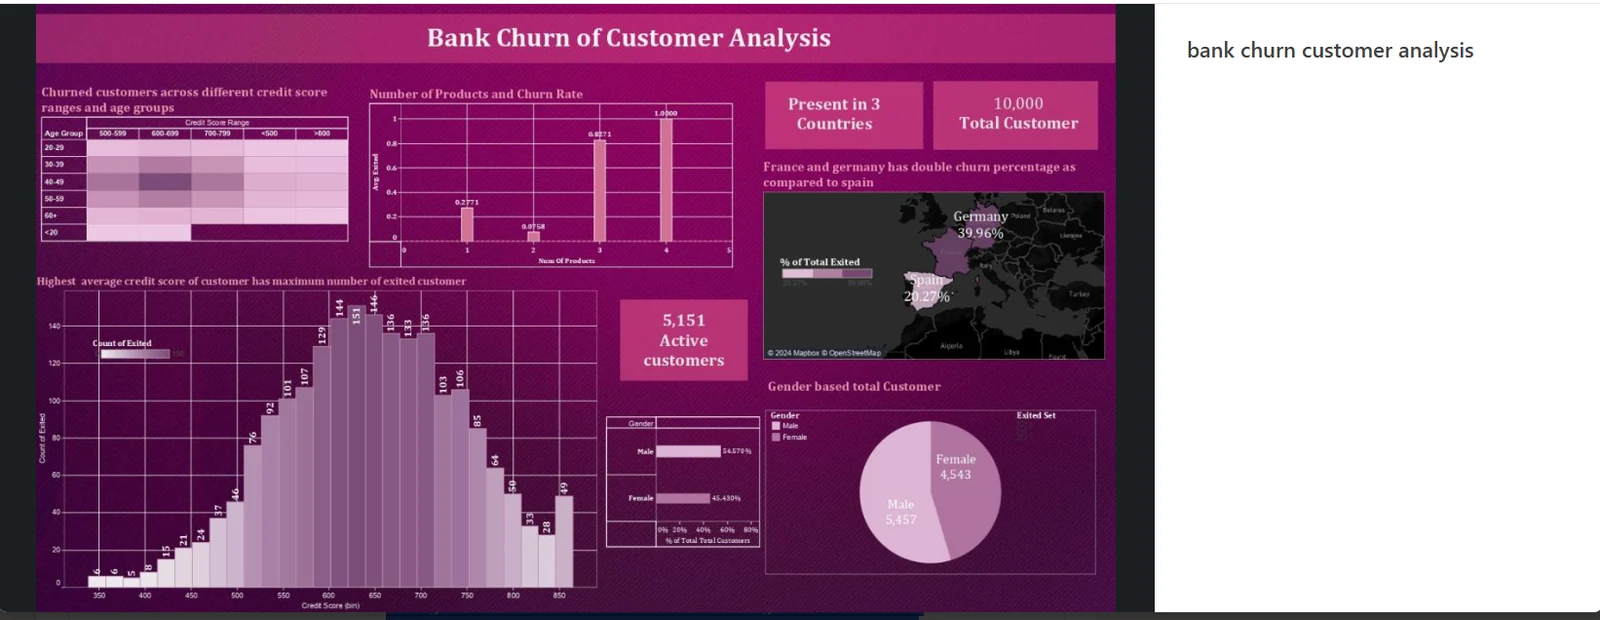
Tableau dashboard analysing bank customer churn by country, product count and credit score

Bank Churn — the visual layer

Tableau counterpart to the churn study. The finding that stuck: customers holding four products churned at close to 100%. Over-selling tracks with dissatisfaction, not loyalty.

Tableauscikit-learn XGBoost
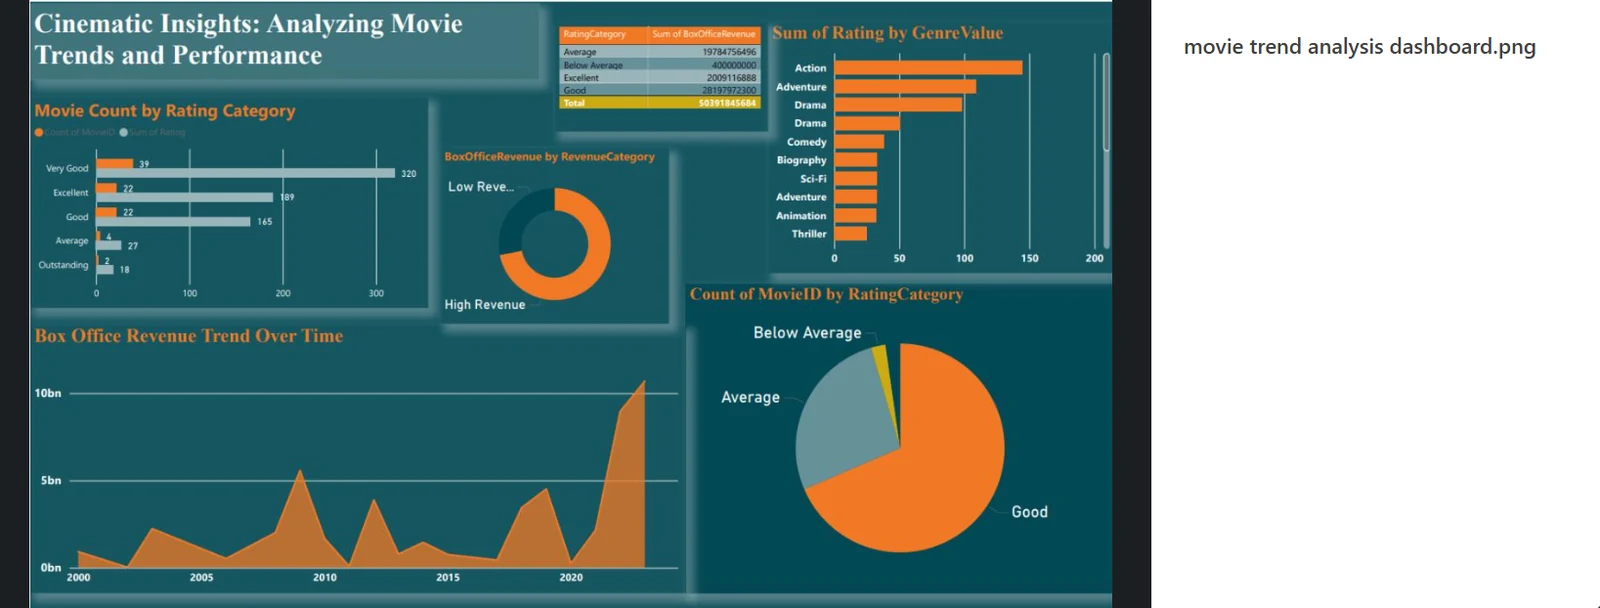
Power BI dashboard showing box office revenue trends, genre performance and audience ratings

Cinematic Insights

Box office revenue, genre performance and ratings across two decades, segmented into high and low revenue bands to isolate what separates a hit from an underperformer.

Power BIData modelling
Coursework TensorFlow · statsmodels · Prophet2024

ETH-USD Time Series Forecasting

Question

Five years of a famously unpredictable asset. Can a neural network read structure that ARIMA-family models cannot?

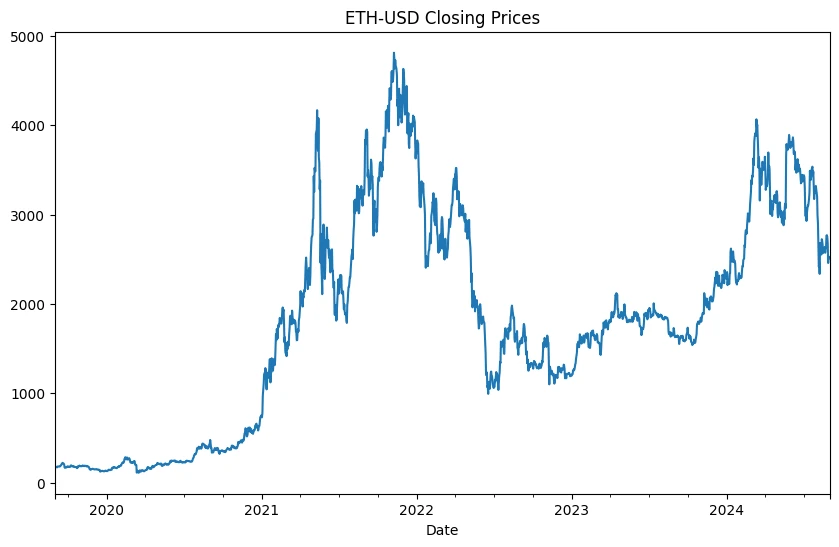
Line chart of ETH-USD daily closing prices from 2020 to 2024, peaking near 4800 in late 2021
The series. 1,827 daily closes, Sept 2019 – Aug 2024. A 20× run-up, a collapse, and a partial recovery — non-stationary by inspection, confirmed by an ADF test (p = 0.34).

Result

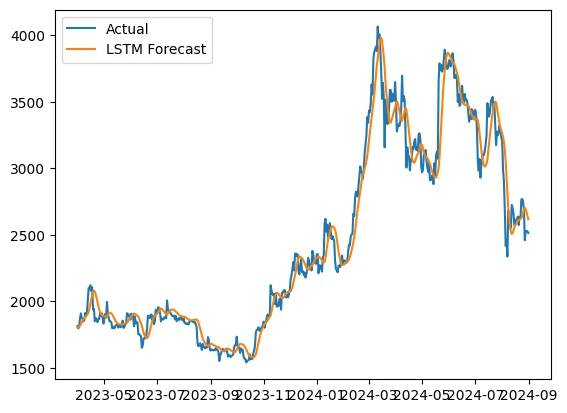
LSTM forecast plotted against actual ETH prices over the test period, tracking closely
LSTM vs. actual across the held-out period — it tracks the turning points, not just the trend.

Four approaches scored by RMSE on the same held-out split. LSTM won by roughly 7.6×.

LSTM 135.82
SARIMA 1031.44
Holt's Winter 1040.08
Prophet 1594.13

Caveat: the LSTM runs unseeded, so its RMSE shifts between runs. One run against deterministic baselines is suggestive, not conclusive.

TensorFlow / Kerasstatsmodels pmdarimaProphet
View the notebook on GitHub →

04 What I work in

Four things I keep coming back to

Not a skills list — the four areas everything above actually sits in.

Machine Learning

Clustering and ensembles on behavioural data — and checking whether the model's assumptions actually hold.

scikit-learn · XGBoost
TensorFlow / Keras · statsmodels

Databases & SQL

Query design at investigation scale — 26 documented BigQuery queries in a single root-cause chain.

BigQuery · SQL
Query optimisation · Data modelling

Generative AI

NLP summarisation that runs on-premises because the documents aren't allowed to leave. Certified in AI-assisted SQL.

Prompt engineering · NLP
Vanderbilt GenAI SQL, 2026

Cloud & Platforms

Warehouse-scale analysis on Google Cloud, and the opposite constraint: models that must stay strictly local.

Google BigQuery · Colab
Cloud Computing cert, 2024

05 Direction

What I want to work on next

Every one of these started as something that went wrong above. The limitation on the left is real; the direction on the right is where I'd go because of it.

01

Clustering when the assumptions fail

K-means returns three neat segments whether or not three segments exist. I want methods that can express doubt — density and mixture models for data that is heavy-tailed and genuinely continuous at the boundaries. When should a method be allowed to assign nothing at all?

Limitation hit K-means partitioning a continuum → Direction GMM · DBSCAN · soft membership
02

Interpretability that survives scrutiny

My churn model said Age mattered most — but impurity importance favours continuous features whether or not they carry signal, so I couldn't tell how much of that was the data and how much was the measure. Attribution has to hold up against its own bias, and a probability has to mean what it says.

Limitation hit An importance ranking I couldn't fully trust → Direction Permutation · SHAP · calibration
03

Learning where data can't leave

The audit tooling I build runs entirely on-premises because the documents are not permitted to leave the building. That constraint shapes every design decision — and it's the same constraint facing healthcare, finance and government data. Useful models under strict data locality is a research problem, not an inconvenience.

Constraint met Documents that cannot reach an external API → Direction On-device & privacy-preserving ML

Education

M.Sc. Big Data Analytics

St. Xavier's College, Mumbai (Autonomous)

Aug 2023 — Jun 2025
9.51 / 10CGPA

B.Sc. Mathematics

B. N. Bandodkar College

Jun 2020 — Jun 2023
9.25 / 10CGPA

Linear algebra and probability first, data second. It's why a distance metric reads as a choice rather than a default.

Certificates

Generative AI SQL Database Specialist with ChatGPT Latest

Vanderbilt University · Coursera · Jul 2026

AI-assisted SQL generation, database design, prompt engineering and query optimisation.

Introduction to Cloud Computing

SimpliLearn · Jan 2024

Machine Learning

Great Learning Academy · Dec 2023

Contact

Let's talk.

Happy to share the full project reports, or talk through any of the work above.